Instrument your NodeJS App With OpenTelemetry
Guide to connecting your Nest app with Jagear via OpenTelemetry

S
Passionate about all areas of computer science, currently exploring DevOps, SRE and Linux
Search for a command to run...
Guide to connecting your Nest app with Jagear via OpenTelemetry
Passionate about all areas of computer science, currently exploring DevOps, SRE and Linux
No comments yet. Be the first to comment.
Guesstimating the counts when memory is tight
Introduction Word cache originates from French word cacher which means to hide. Outside computer science circle it refers to a secret place where you hide things, usually emergency supplies. In computer science though the meaning of the word is flipp...

Introduction Rate limiting is a must have strategy in every back-end app. It prevent one user from overusing a resource and degrading the quality of service for other users. Here are some benefits of rate limiting It presents resource starvation Re...

A quick guide on partitioning, sharding, and replication

On this page
Have you ever had a bug that occurred in production and you have no idea what went wrong because your logs won’t tell you exactly what went wrong or a request that takes usually long to process.
Sometimes debugging these issues without a tracing system is impossible. A tracing system is like a CCTV camera that captures every thing what happened, when did it happen, what was the order of events, how long did it each event take. This information is vital for debugging and identifying performance bottlenecks in complex distributed applications.
NodeJS
Typescript
NestJS
Docker
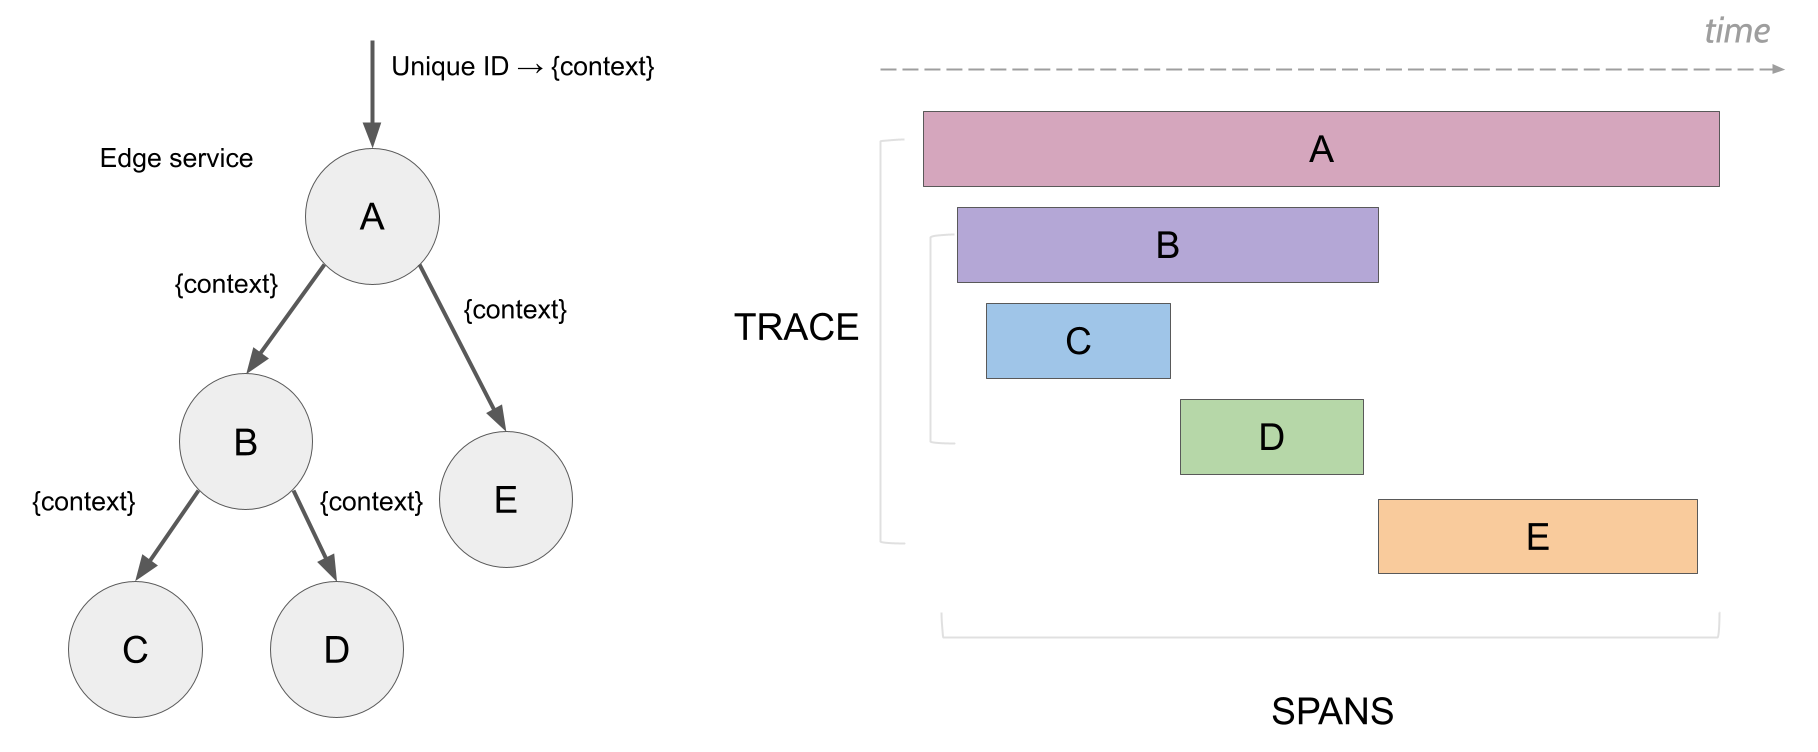
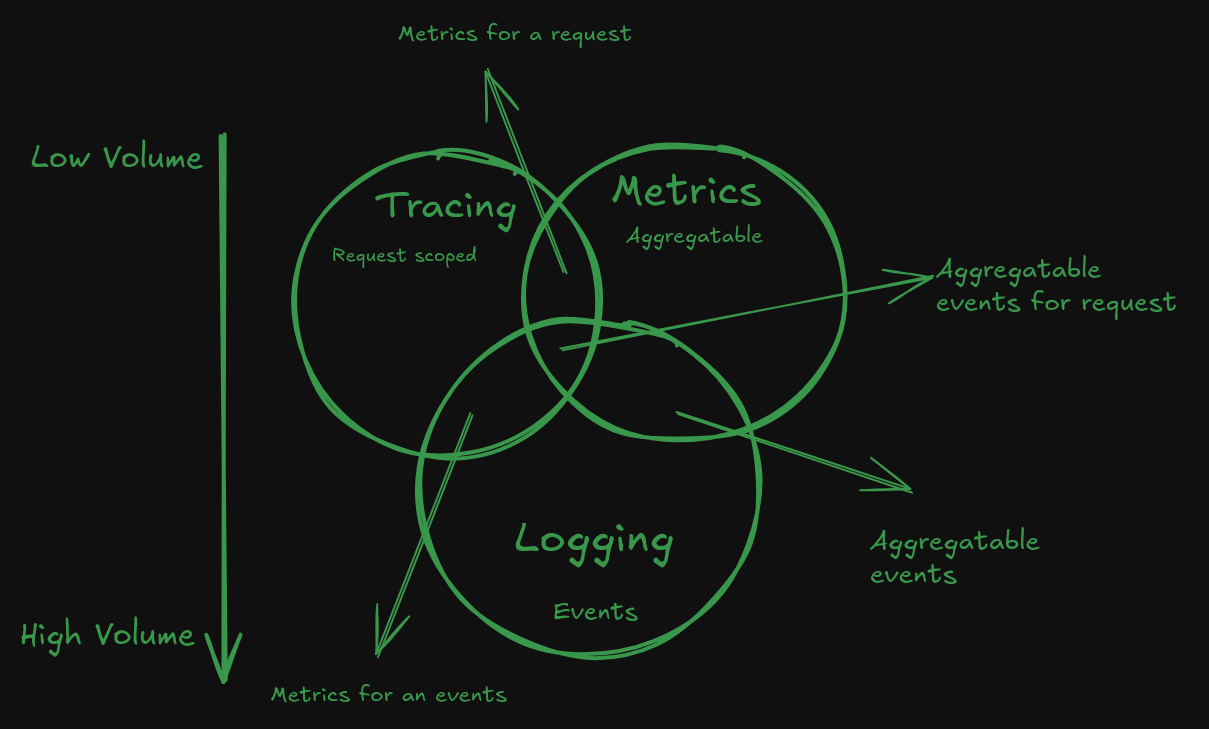
Trace: A trace is like a complete journey map of a single request as it moves through your entire distributed system. Imagine it as a detailed travel log that follows a request from its starting point to its final destination, capturing every stop and interaction along the way.
Instrumentation: The process of adding code to your application to collect telemetry data. It's like installing GPS trackers in different parts of your system.
Exporter: A component responsible for sending collected trace data to a back-end system for storage and analysis. Think of it as a postal service that sends your travel logs to a central archive.
Span:
Root span: The first span in a trace, marking the beginning of the entire request journey. It's like the starting point of your travel log.
Child span: A span that is nested within another span, representing a more specific operation within a broader process.
Context propagation: The mechanism of transferring trace information between different services and components. It's like passing a traveler's passport that contains their complete journey details.
Metrics: Metrics are numerical data that tells up about app’s performance, health and behavior.
Logs: Logs are text entries describing usage patterns, activities, and operations within your application.
Observability lets you understand a system from the outside by letting you ask questions about that system without knowing its inner workings. It allows you to easily troubleshoot and handle novel problems, that is, “unknown unknowns”. It also answers the question “Why is this happening?”
pnpm i -g @nestjs/cli
nest new tracing-app
cd tracing-app
Install Jaeger and OpenTelemetry related libraries:
pnpm install @opentelemetry/sdk-trace-node @opentelemetry/resources @opentelemetry/sdk-trace-base
pnpm install @opentelemetry/instrumentation @prisma/instrumentation @opentelemetry/instrumentation-net @opentelemetry/instrumentation-http @opentelemetry/instrumentation-express
pnpm install @opentelemetry/exporter-trace-otlp-http
pnpm install @opentelemetry/api @opentelemetry/semantic-conventions
Install Prisma ORM and SQLite:
pnpm install @prisma/client sqlite3 class-validator
pnpm install prisma --save-dev
pnpm install --save @nestjs/swagger
Initialize Prisma:
npx prisma init
This will create a prisma directory with a schema.prisma file.
datasource db {
  provider = "sqlite"
  url      = "file:./dev.db"
}

generator client {
  provider = "prisma-client-js"
}

model User {
  id    Int     @id @default(autoincrement())
  name  String
  email String  @unique
}
Run Prisma migrations:
npx prisma migrate dev --name init
Generate Prisma Client:
npx prisma generate
Generate a CRUD module for users
pnpm nest generate resource users
This will create a users module with a controller, service, and DTOs.
Create a prisma.service.ts file in prisma folder
import { Injectable, OnModuleInit, OnModuleDestroy } from '@nestjs/common';
import { PrismaClient } from '@prisma/client';

@Injectable()
export class PrismaService extends PrismaClient implements OnModuleInit, OnModuleDestroy {
  async onModuleInit() {
    await this.$connect();
  }

  async onModuleDestroy() {
    await this.$disconnect();
  }
}
Update the users.module.ts file to include the PrismaService:
import { Module } from '@nestjs/common';
import { UsersService } from './users.service';
import { UsersController } from './users.controller';
import { PrismaService } from '../../prisma/prisma.service';

@Module({
  controllers: [UsersController],
  providers: [UsersService, PrismaService],
})
export class UsersModule { }
Create a file named create-user.dto.ts in the users/dto directory:
import { IsEmail, IsNotEmpty, IsString } from 'class-validator';
import { ApiProperty } from '@nestjs/swagger';

export class CreateUserDto {
    @ApiProperty({
        description: 'The name of the user',
        example: 'John Doe',
    })
    @IsNotEmpty()
    @IsString()
    name: string;

    @ApiProperty({
        description: 'The email of the user',
        example: 'email@domain.com',
    })
    @IsNotEmpty()
    @IsEmail()
    email: string;
}

export class UpdateUserDto extends PartialType(CreateUserDto) {}
Update the users.service.ts file to use Prisma:
import { Injectable } from '@nestjs/common';
import { PrismaService } from '../prisma/prisma.service';
import { CreateUserDto } from './dto/create-user.dto';
import { UpdateUserDto } from './dto/update-user.dto';

@Injectable()
export class UsersService {
  constructor(private prisma: PrismaService) {}

  create(createUserDto: CreateUserDto) {
    return this.prisma.user.create({
      data: createUserDto,
    });
  }

  findAll() {
    return this.prisma.user.findMany();
  }

  findOne(id: number) {
    return this.prisma.user.findUnique({
      where: { id },
    });
  }

  update(id: number, updateUserDto: UpdateUserDto) {
    return this.prisma.user.update({
      where: { id },
      data: updateUserDto,
    });
  }

  remove(id: number) {
    return this.prisma.user.delete({
      where: { id },
    });
  }
}
Update the users.controller.ts file:
import { Controller, Get, Post, Body, Patch, Param, Delete } from '@nestjs/common';
import { UsersService } from './users.service';
import { CreateUserDto } from './dto/create-user.dto';
import { UpdateUserDto } from './dto/update-user.dto';
import { ApiGoneResponse, ApiNotFoundResponse, ApiOkResponse, ApiOperation, ApiParam, ApiTags } from '@nestjs/swagger';

@ApiTags('users')
@Controller('users')
export class UsersController {
  constructor(private readonly usersService: UsersService) { }

  @ApiOperation({ summary: 'Create user' })
  @ApiOkResponse({ description: 'User created' })
  @Post()
  create(@Body() createUserDto: CreateUserDto) {
    return this.usersService.create(createUserDto);
  }

  @ApiOperation({ summary: 'Get all users' })
  @ApiOkResponse({ description: 'Users found' })
  @Get()
  findAll() {
    return this.usersService.findAll();
  }

  @ApiOperation({ summary: 'Get user by id' })
  @ApiOkResponse({ description: 'User found' })
  @ApiNotFoundResponse({ description: 'User not found' })
  @ApiParam({ name: 'id', description: 'User id' })
  @Get(':id')
  findOne(@Param('id') id: string) {
    return this.usersService.findOne(+id);
  }

  @ApiOperation({ summary: 'Update user' })
  @ApiOkResponse({ description: 'User updated' })
  @ApiNotFoundResponse({ description: 'User not found' })
  @ApiParam({ name: 'id', description: 'User id' })
  @Patch(':id')
  update(@Param('id') id: string, @Body() updateUserDto: UpdateUserDto) {
    return this.usersService.update(+id, updateUserDto);
  }

  @ApiOperation({ summary: 'Delete user' })
  @ApiGoneResponse({ description: 'User deleted' })
  @ApiParam({ name: 'id', description: 'User id' })
  @Delete(':id')
  remove(@Param('id') id: string) {
    return this.usersService.remove(+id);
  }
}
Create a file tracing.ts in your src directory:
import { ATTR_SERVICE_NAME, ATTR_SERVICE_VERSION } from '@opentelemetry/semantic-conventions';
import { BatchSpanProcessor } from '@opentelemetry/sdk-trace-base';
import { ExpressInstrumentation } from '@opentelemetry/instrumentation-express';
import { HttpInstrumentation } from '@opentelemetry/instrumentation-http';
import { NetInstrumentation } from '@opentelemetry/instrumentation-net';
import { NodeTracerProvider } from '@opentelemetry/sdk-trace-node';
import { OTLPTraceExporter } from '@opentelemetry/exporter-trace-otlp-http';
import { PrismaInstrumentation } from '@prisma/instrumentation';
import { Resource } from '@opentelemetry/resources';
import { diag, DiagConsoleLogger, DiagLogLevel } from '@opentelemetry/api';
import { registerInstrumentations } from '@opentelemetry/instrumentation';

export function setupTracing() {
    // Enable OpenTelemetry diagnostic logging
    diag.setLogger(new DiagConsoleLogger(), DiagLogLevel.INFO);

    // Create a resource with service information
    const resource = new Resource({
        [ATTR_SERVICE_NAME]: process.env.SERVICE_NAME || 'tracer-app',
        [ATTR_SERVICE_VERSION]: process.env.npm_package_version || '1.0.0',
    });

    const otlpExporter = new OTLPTraceExporter({
        url: process.env.OTEL_EXPORTER_OTLP_ENDPOINT || 'http://localhost:4318/v1/traces',
    });


    // Create tracer provider with resource and span processors
    const provider = new NodeTracerProvider({
        resource,
        spanProcessors: [
            new BatchSpanProcessor(otlpExporter, {
                maxQueueSize: 100,
                scheduledDelayMillis: 5000,
                exportTimeoutMillis: 30000,
                maxExportBatchSize: 50,
            })
        ]
    });

    // Register instrumentations with more comprehensive coverage
    registerInstrumentations({
        tracerProvider: provider,
        instrumentations: [
            new HttpInstrumentation({
                requestHook: (span, request) => {
                    span.setAttribute('http.request.method', request.method);
                },
            }),
            new NetInstrumentation(),
            new ExpressInstrumentation(),
            new PrismaInstrumentation({ middleware: true }),
        ],
    });

    // Register the provider
    provider.register();

    // Return the provider for potential manual instrumentation
    return provider;
}

// Call this at application startup
setupTracing();
Diagnostic Logging: Enables diagnostic logging using a console logger at the INFO level to debug tracing setup.
Resource Initialization:
Defines metadata about the service, like SERVICE_NAME and SERVICE_VERSION.
This metadata is attached to every trace and helps identify which service the trace belongs to.
OTLP Trace Exporter: Configures the OpenTelemetry Protocol (OTLP) exporter to send trace data to the backend which is Jaeger for now using HTTP protocol. Note that Jaeger can be swapped with other backend like Honeycomb, Zipkin etc and you change the protocol to more efficient GRPC from current HTTP.
Tracer Provider with Span Processor: Creates a NodeTracerProvider, which manages tracers and spans:
Resource: Includes service metadata.
BatchSpanProcessor: Buffers spans and exports them in batches to minimize performance impact. Key configurations:
maxQueueSize: Maximum spans in the queue before flushing.
scheduledDelayMillis: Frequency of flushing spans.
exportTimeoutMillis: Max time allowed for export.
maxExportBatchSize: Maximum spans per export batch.
Register Instrumentation: Automatically captures traces for libraries and frameworks:
HttpInstrumentation: Captures time taken by HTTP requests/responses.
NetInstrumentation: Captures time taken by low-level networking events.
ExpressInstrumentation: Tracks time taken by Express middleware and routes.
PrismaInstrumentation: Tracks time taken by SQL queries generated by Prisma
Import and initialize the tracing configuration in your main application file main.ts:
import { NestFactory } from '@nestjs/core';
import { SwaggerModule, DocumentBuilder } from '@nestjs/swagger';
import { AppModule } from './app.module';
import './tracing';

async function bootstrap() {
  const app = await NestFactory.create(AppModule);

  const config = new DocumentBuilder()
    .setTitle('Tracing example')
    .setDescription('The tracing API description')
    .setVersion('1.0')
    .addTag('tracing')
    .build();
  const documentFactory = () => SwaggerModule.createDocument(app, config);
  SwaggerModule.setup('api-docs', app, documentFactory);

  await app.listen(process.env.PORT ?? 3000);
}
bootstrap();
pnpm run start:dev
Easiest way to setup Jaeger is with docker-compose winch will work fine a development environment.
Create docker-compose.yaml file:
services:
  jaeger:
    image: jaegertracing/all-in-one:1.63.0
    container_name: jaeger
    environment:
      COLLECTOR_OTLP_ENABLED: "true"
    ports:
      - "4317:4317" # For Jaeger-GRPC
      - "4318:4318" # For Jaeger-HTTP
      - "16686:16686" # # Web UI

networks:
  default:
    driver: bridge
You can use docker init command to automatically generate an optimized Dockerfile if you have newer version of docker installed.
# Arguments for versions
ARG NODE_VERSION=20.18.0
ARG PNPM_VERSION=9.12.2
ARG ALPINE_VERSION=3.20

################################################################################
# Base stage: Build the application
FROM node:${NODE_VERSION}-alpine${ALPINE_VERSION} AS builder

# Set working directory
WORKDIR /usr/src/app

# Install pnpm globally with cache
RUN --mount=type=cache,target=/root/.npm \
    npm install -g pnpm@${PNPM_VERSION}

# Copy package.json and pnpm-lock.yaml to install dependencies
COPY ../package.json pnpm-lock.yaml ./

# Install dependencies with cache
RUN --mount=type=cache,target=/root/.pnpm-store \
    pnpm install --frozen-lockfile

# Copy the all application code
COPY .. .

# Setup prisma
RUN pnpm prisma generate

# Build the application
RUN pnpm run build

# Runner Stage
FROM node:${NODE_VERSION}-alpine${ALPINE_VERSION} AS runner

# Set working directory
WORKDIR /usr/src/app

# Copy the built application from the builder stage
COPY --from=builder /usr/src/app/dist ./dist
COPY ../package.json pnpm-lock.yaml ./
COPY ../prisma/schema.prisma ./prisma/schema.prisma

# Install pnpm globally
RUN --mount=type=cache,target=/root/.npm \
    npm install -g pnpm@${PNPM_VERSION}

# Install dependencies with cache
RUN --mount=type=cache,target=/root/.pnpm-store \
    pnpm install --frozen-lockfile --prod

# Set NODE_ENV to production
ENV NODE_ENV=production

# Run the application
CMD ["pnpm", "run", "start:prod"]
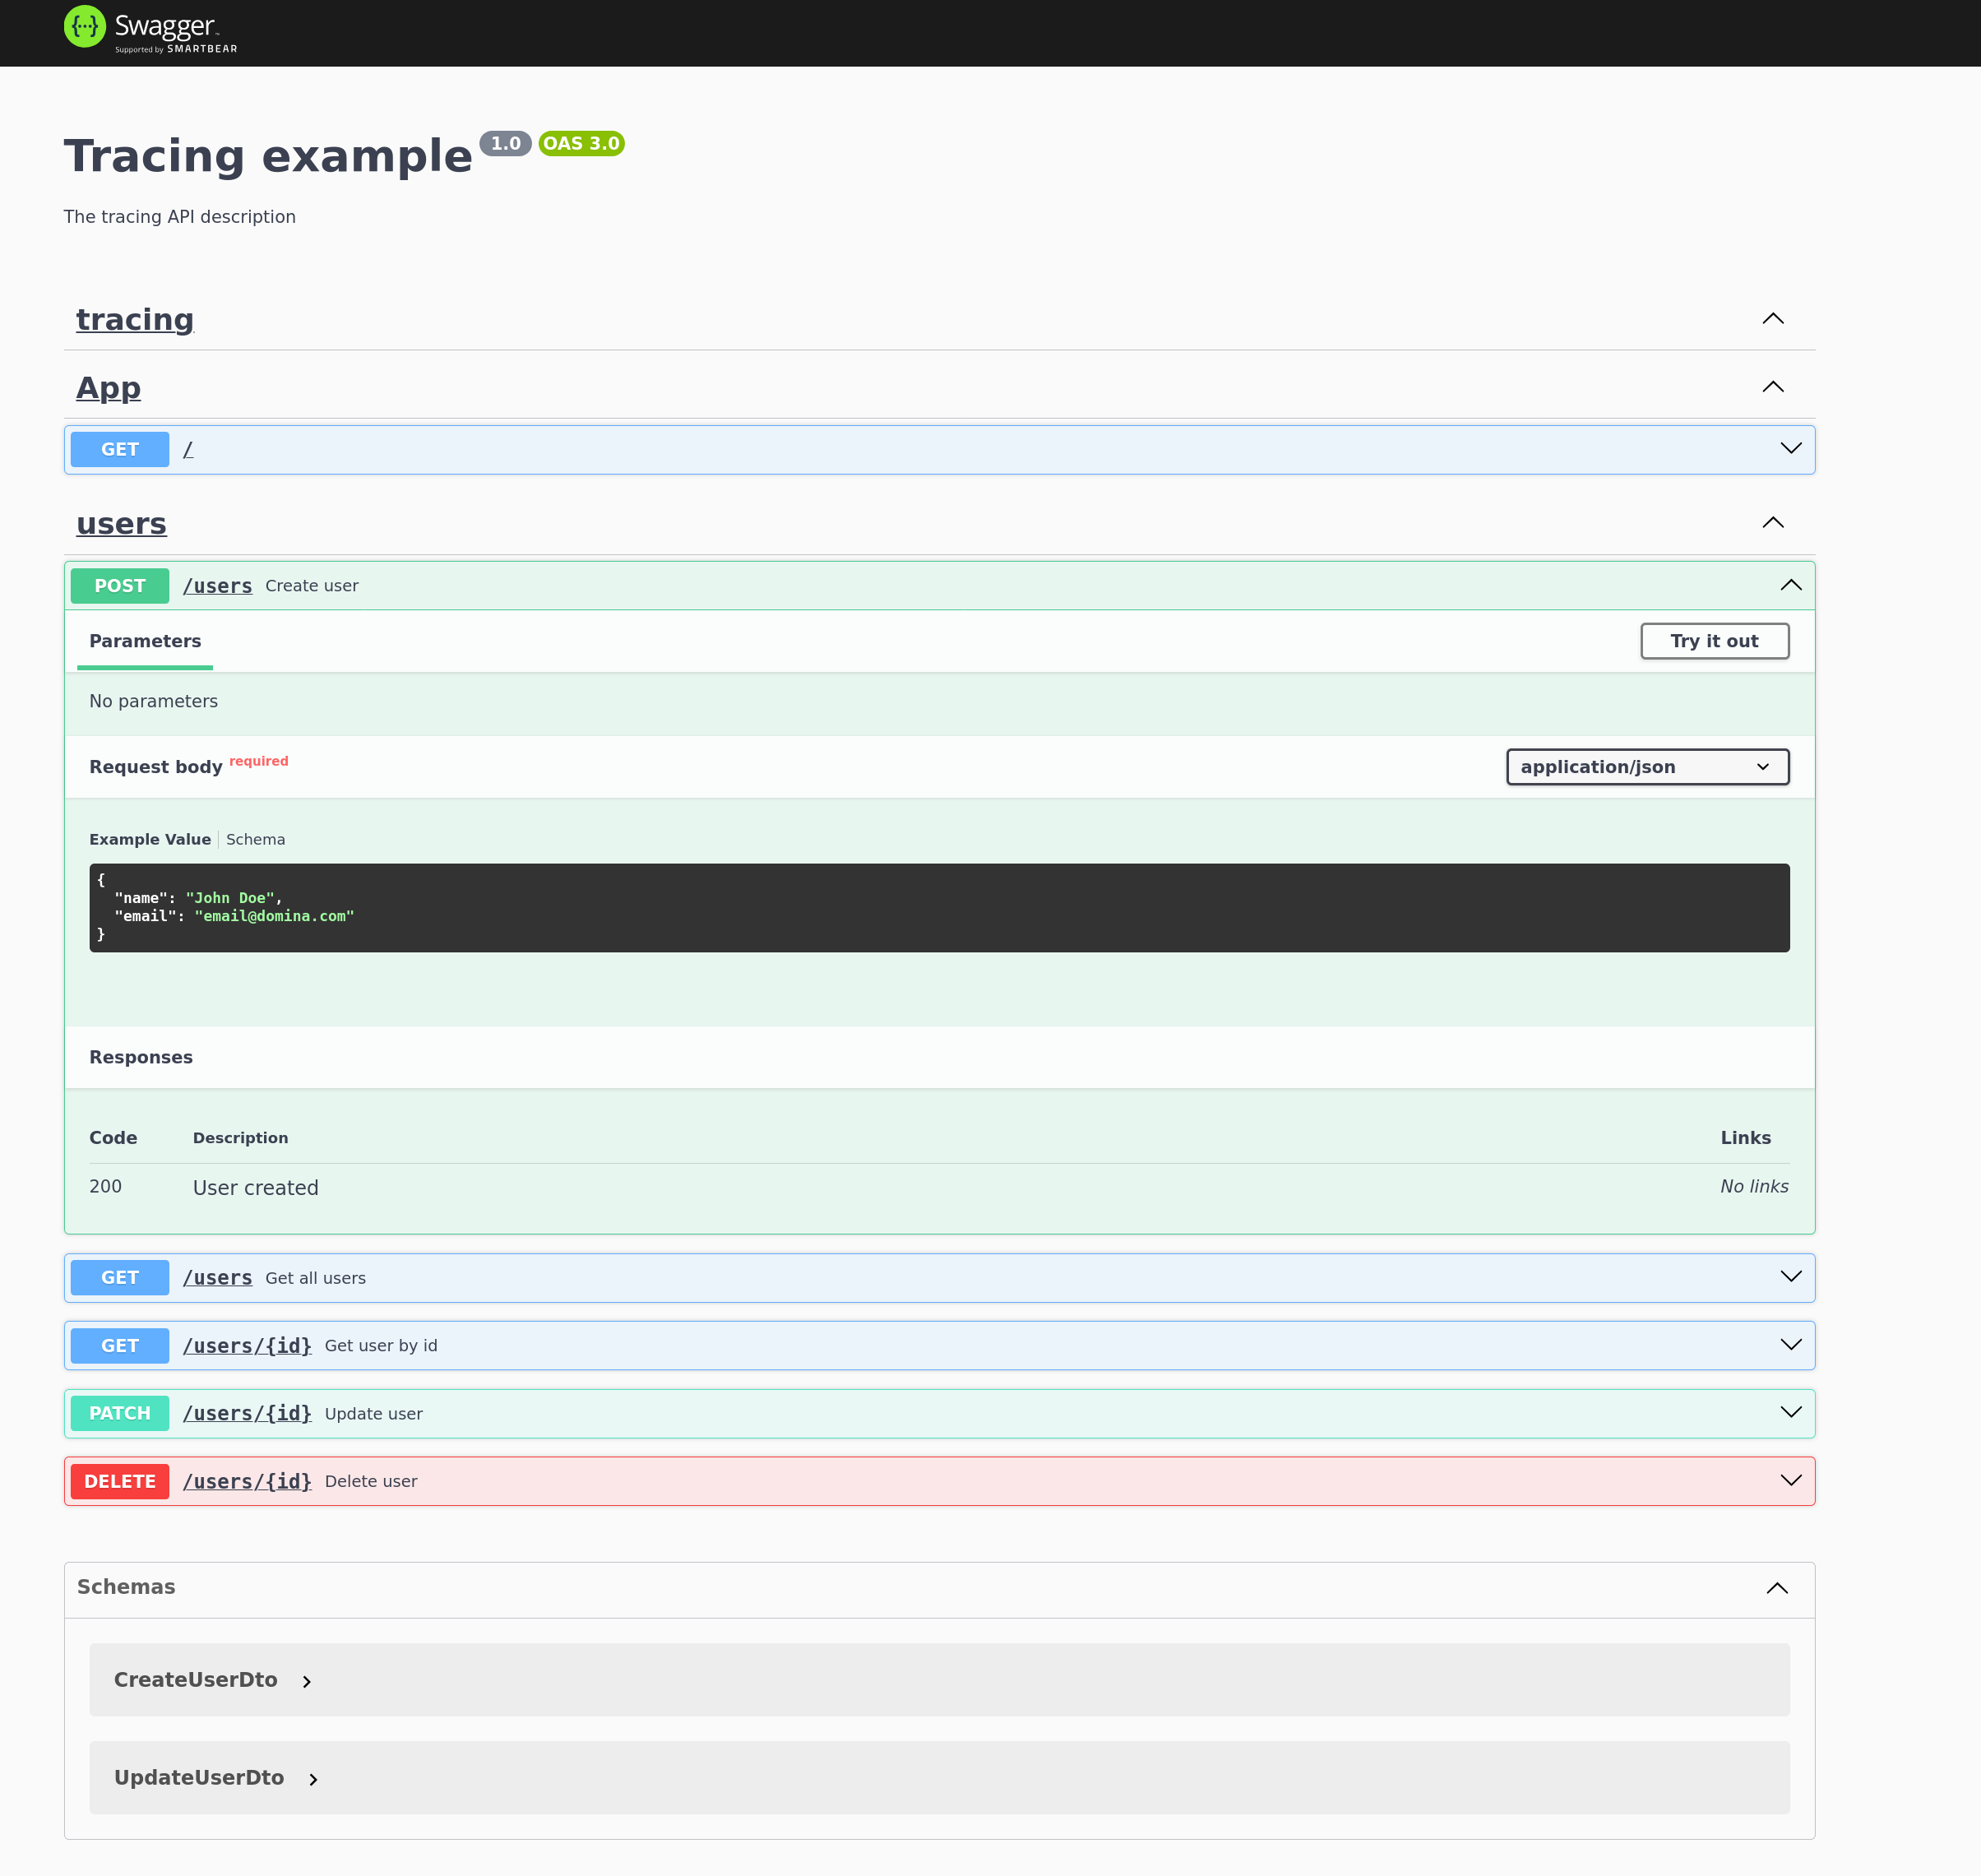
Visit http://localhost:3000/api-docs and make some API calls
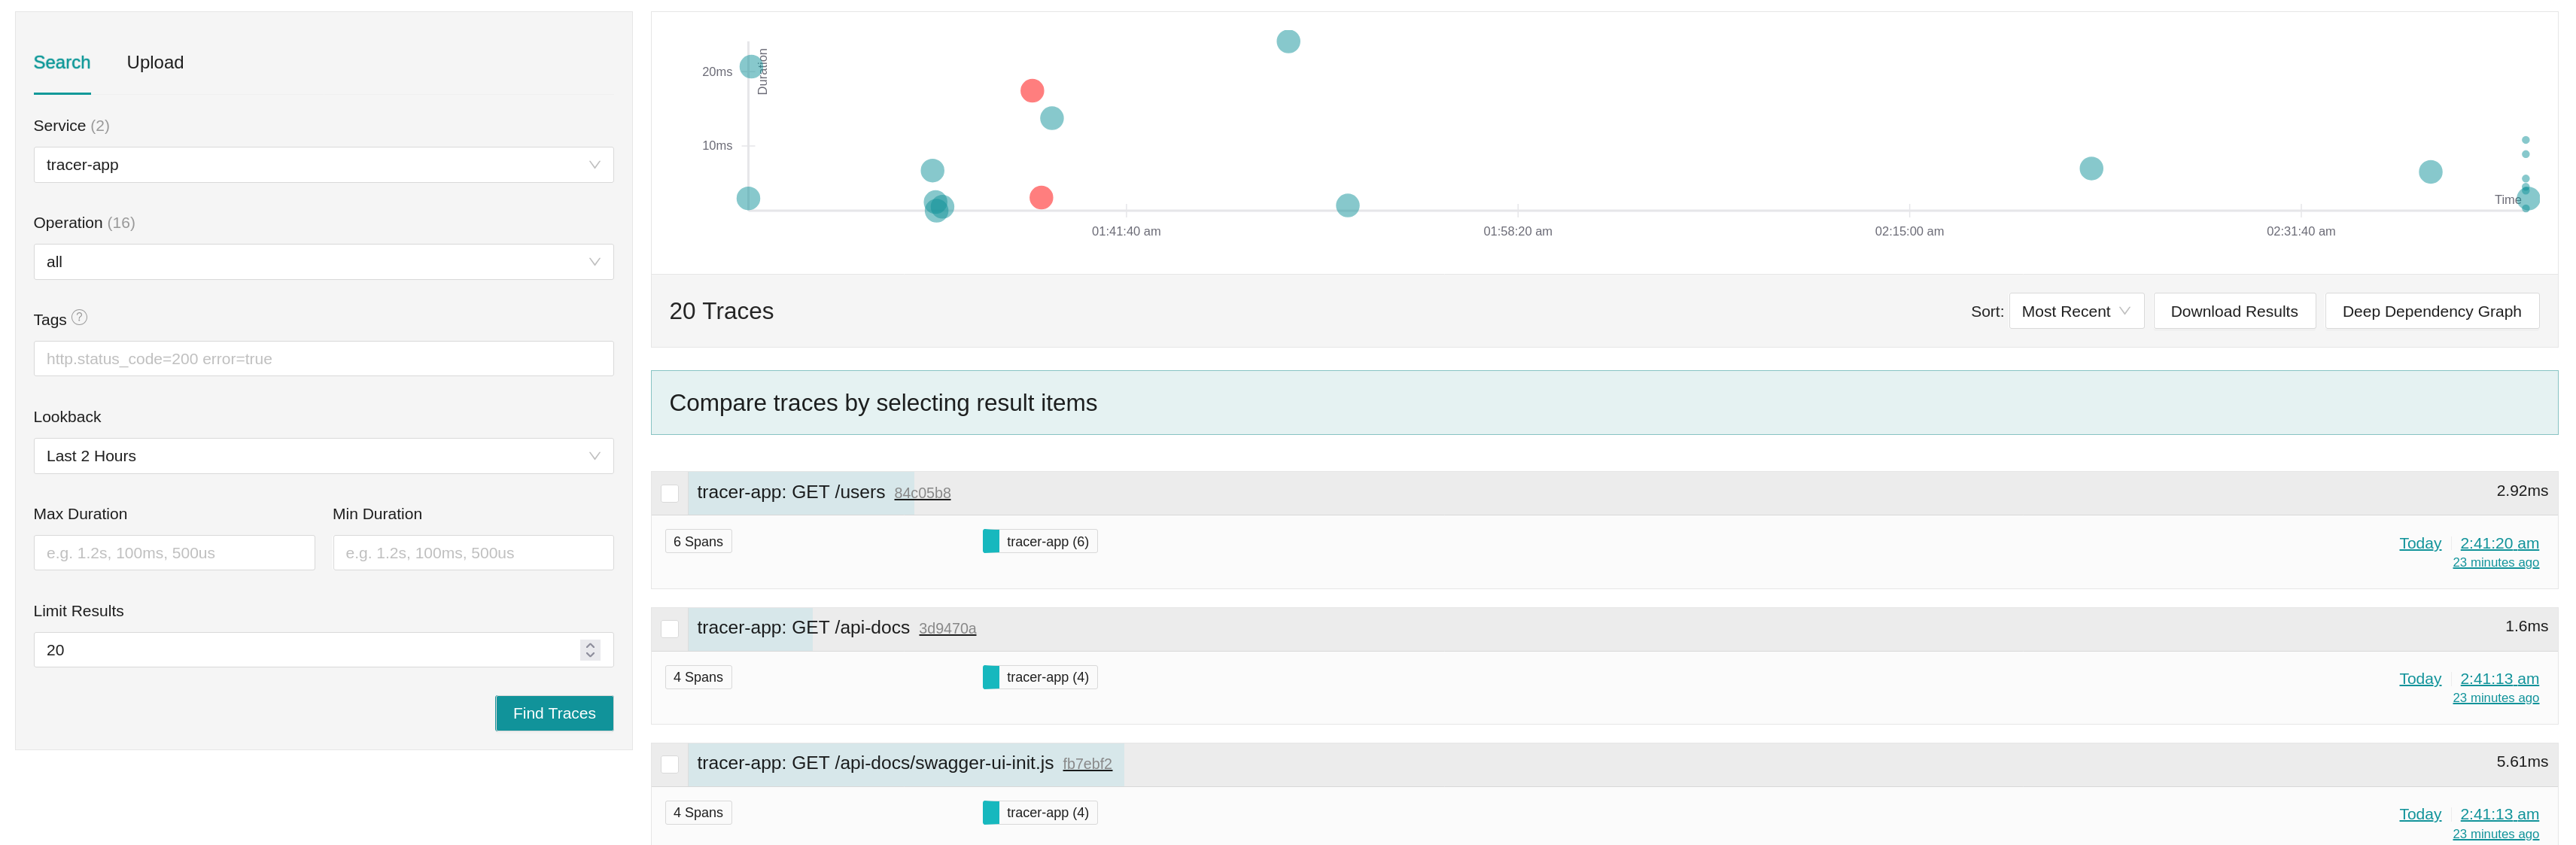
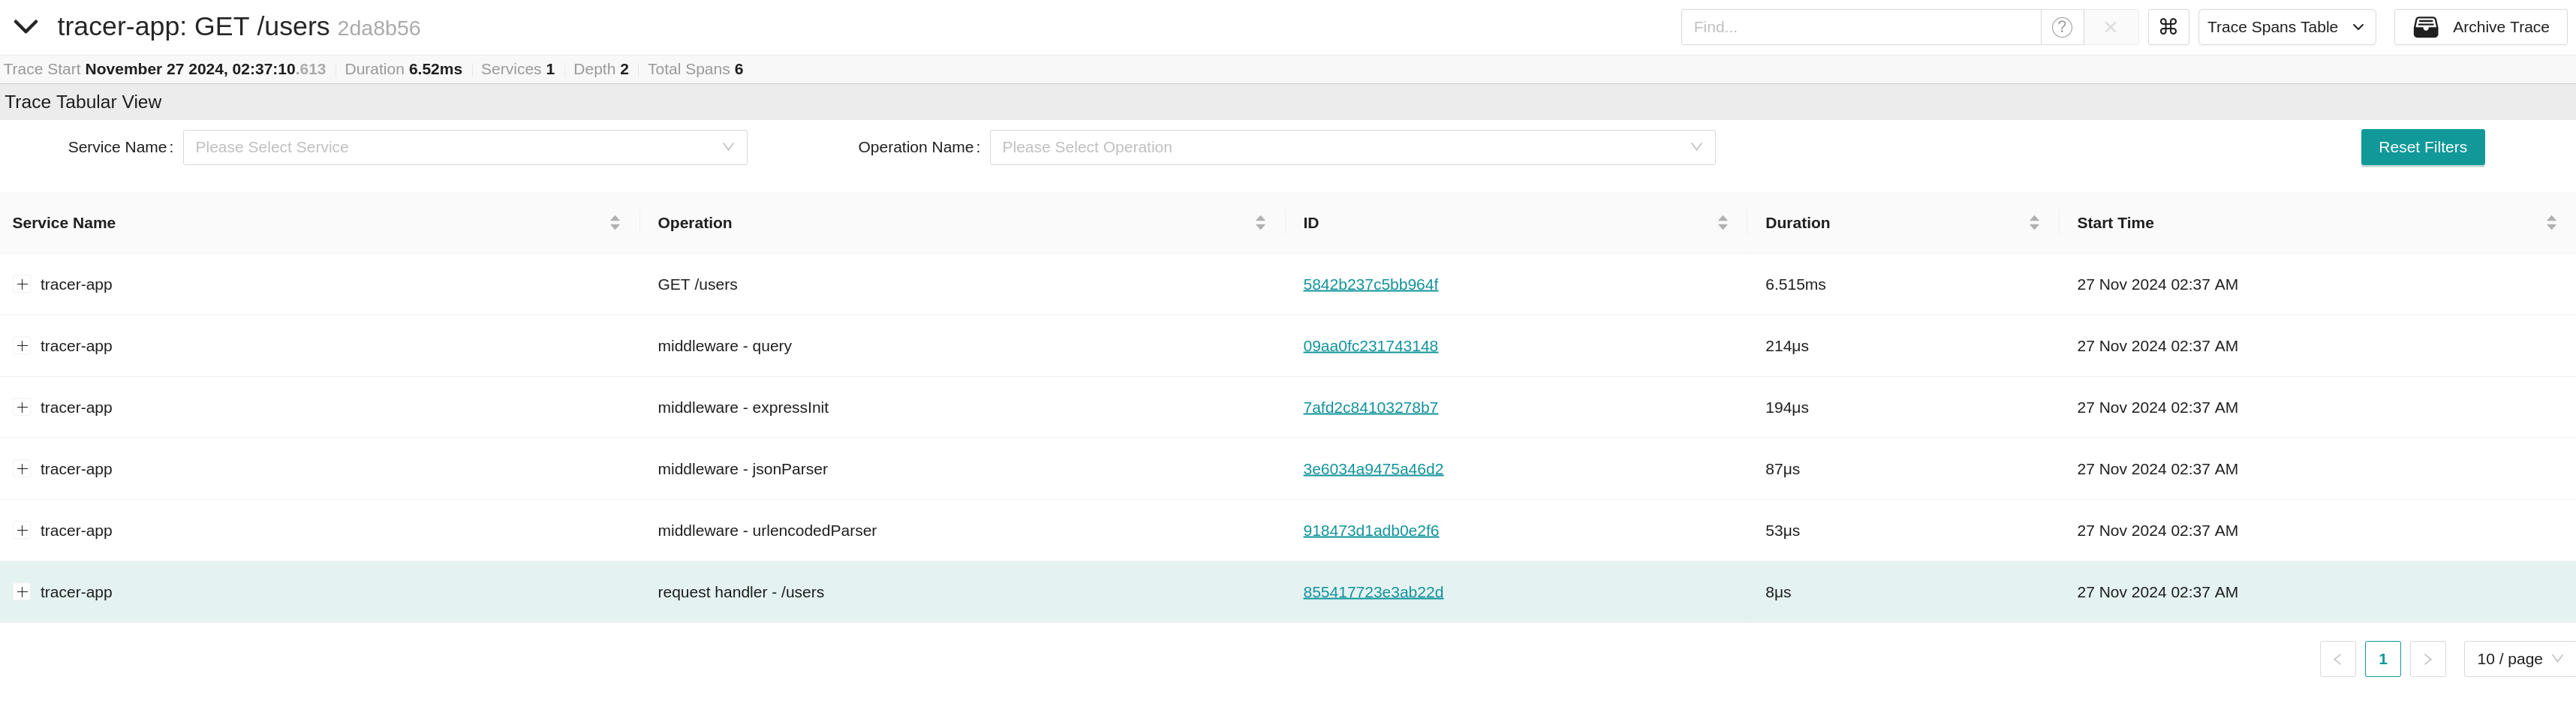
Open your browser and go to http://localhost:16686 to see the Jaeger UI. Run some request and click Find Trace and click on a trace